Automated Infrared Fault Diagnosis

Leveraging YOLOv11 to detect 12 classes of solar module anomalies with 71.3% mAP at real-time drone speeds.

Mean Average Precision (mAP@50)
71.3%
Reliable detection across 12 fault classes.
Inference Speed
3.6 ms
Per image (~277 FPS). Ready for edge deployment.
Dataset Scale
20,000+
Infrared images processed & analyzed.

The Challenge

Solar farms are expanding rapidly, but manual inspection is inefficient. Identifying critical faults like Hotspots (fire risk) and Diode Failures (power loss) typically requires hours of manual review per acre.

"Manual inspection is the bottleneck in renewable energy maintenance."

The Automated Pipeline

1. Data Ingestion

Drone IR Imagery

2. YOLOv11 Inference

Object Detection & Classification

3. Actionable Report

Fault Locations & Types

Technical Performance

Precision-Recall Curve

Precision Recall Curve

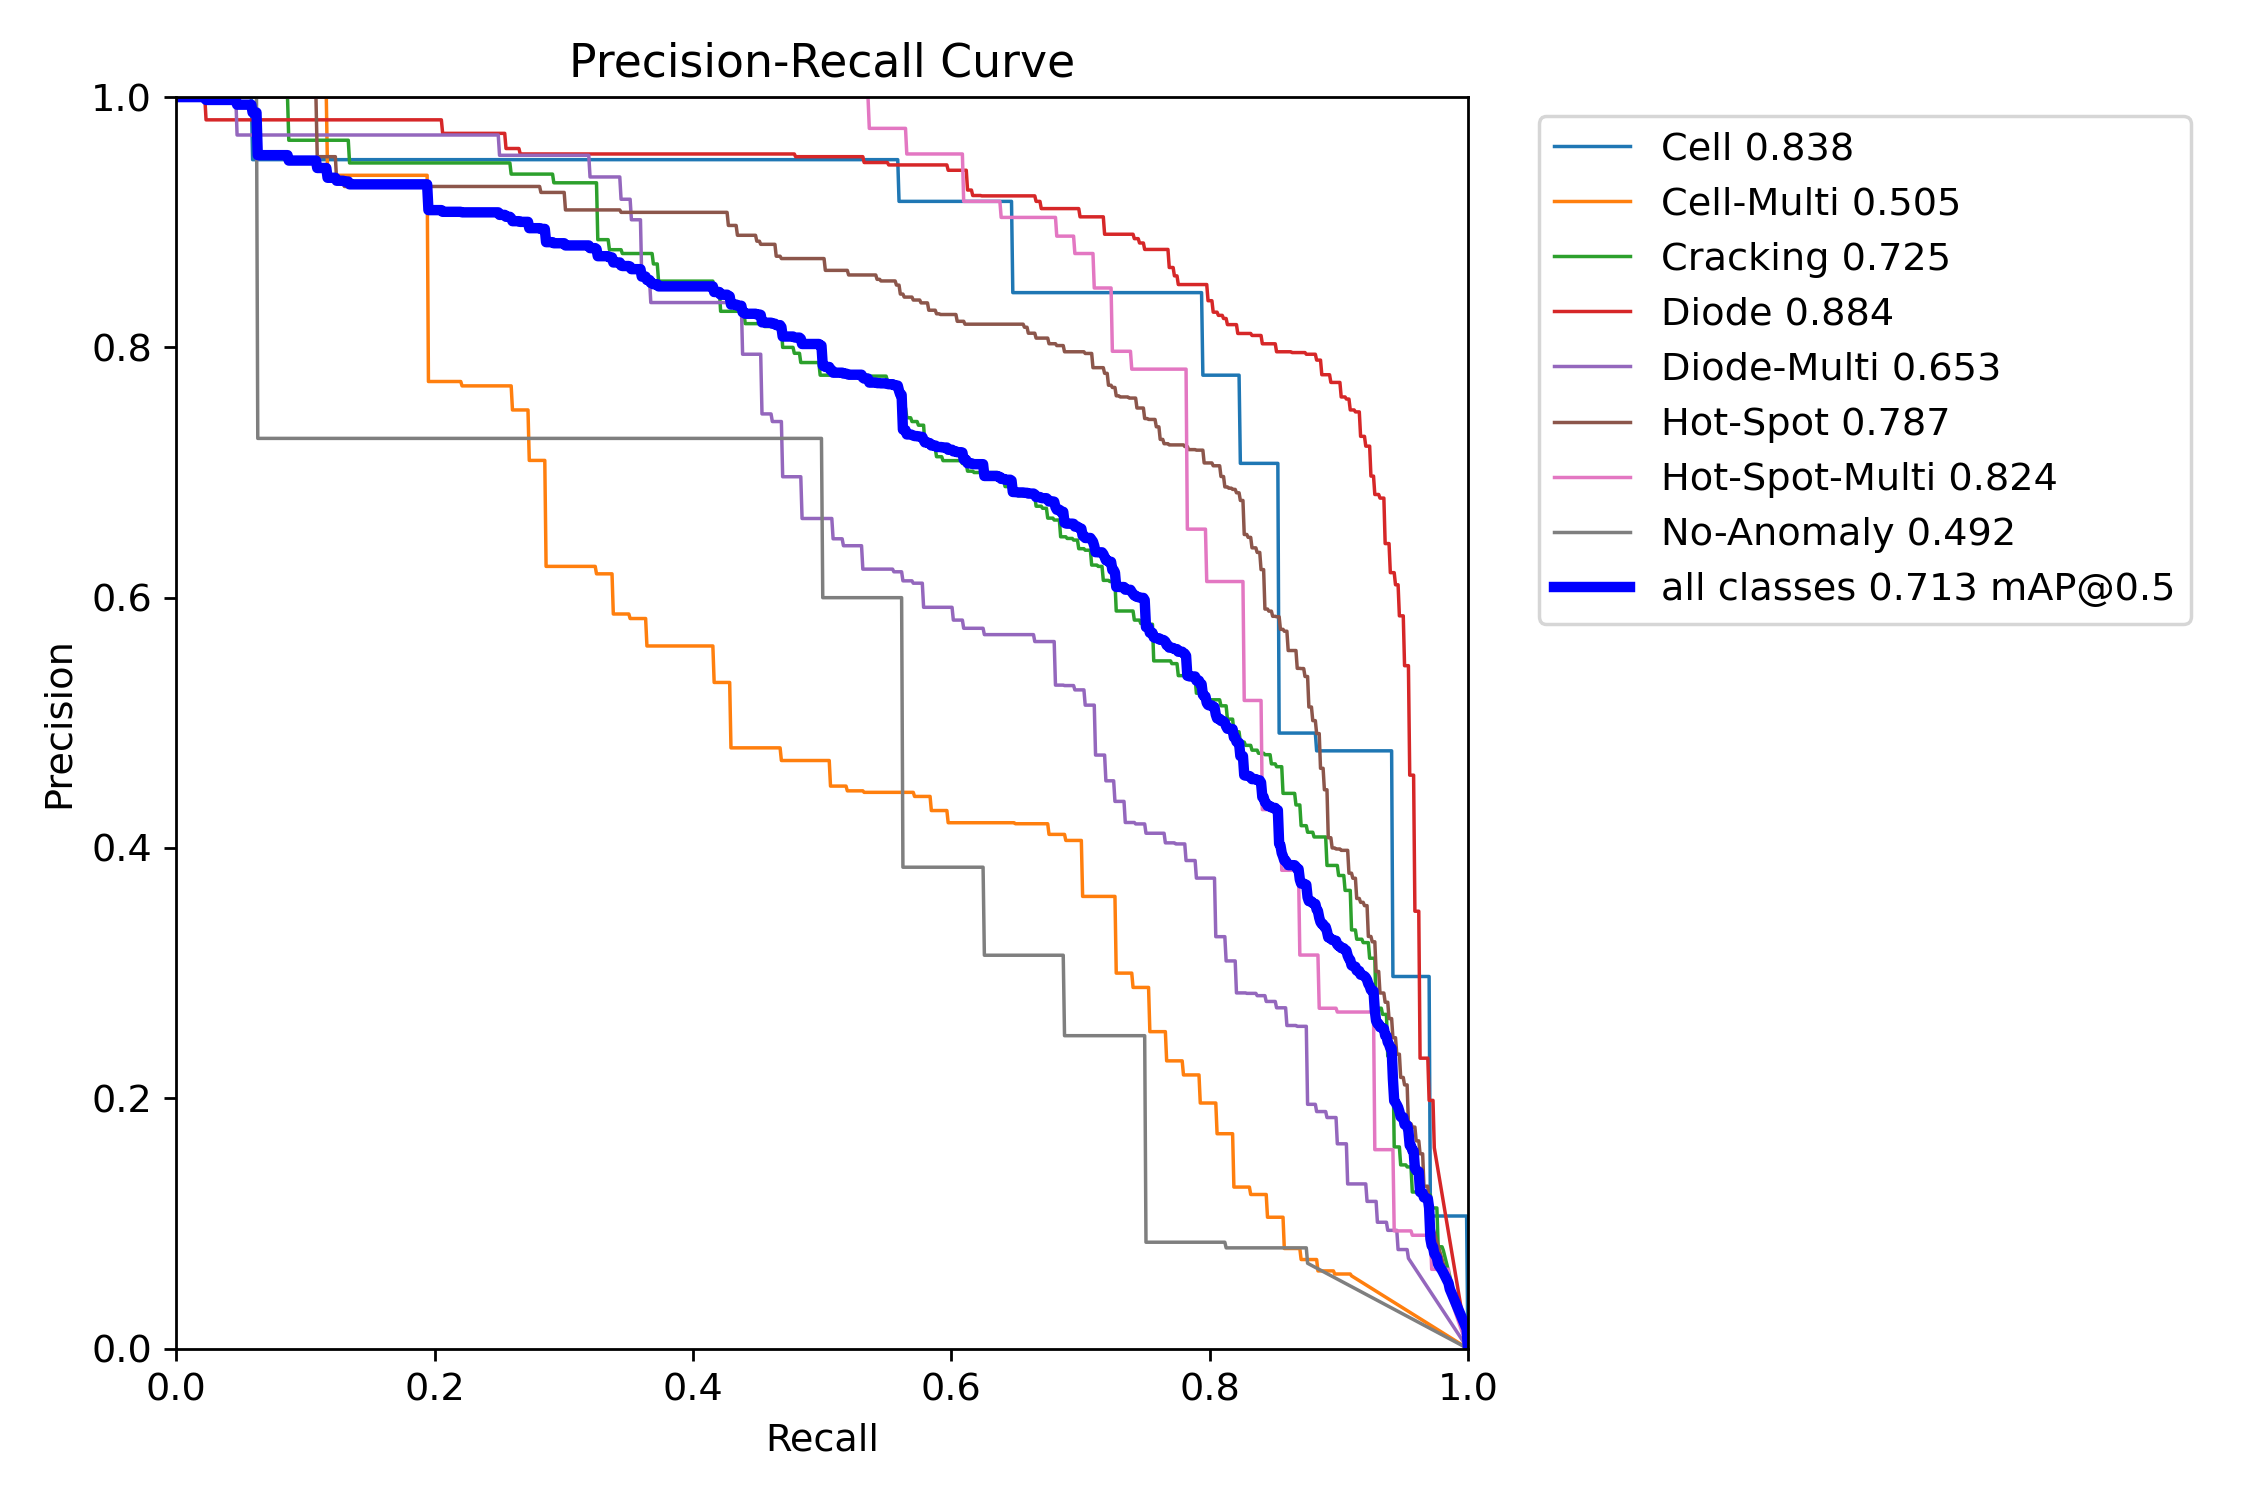
Shows the trade-off between precision and recall. High area under the curve (0.713 mAP@0.5) indicates the model effectively minimizes false positives while maintaining detection capability.

F1-Confidence Curve

F1 Confidence Curve

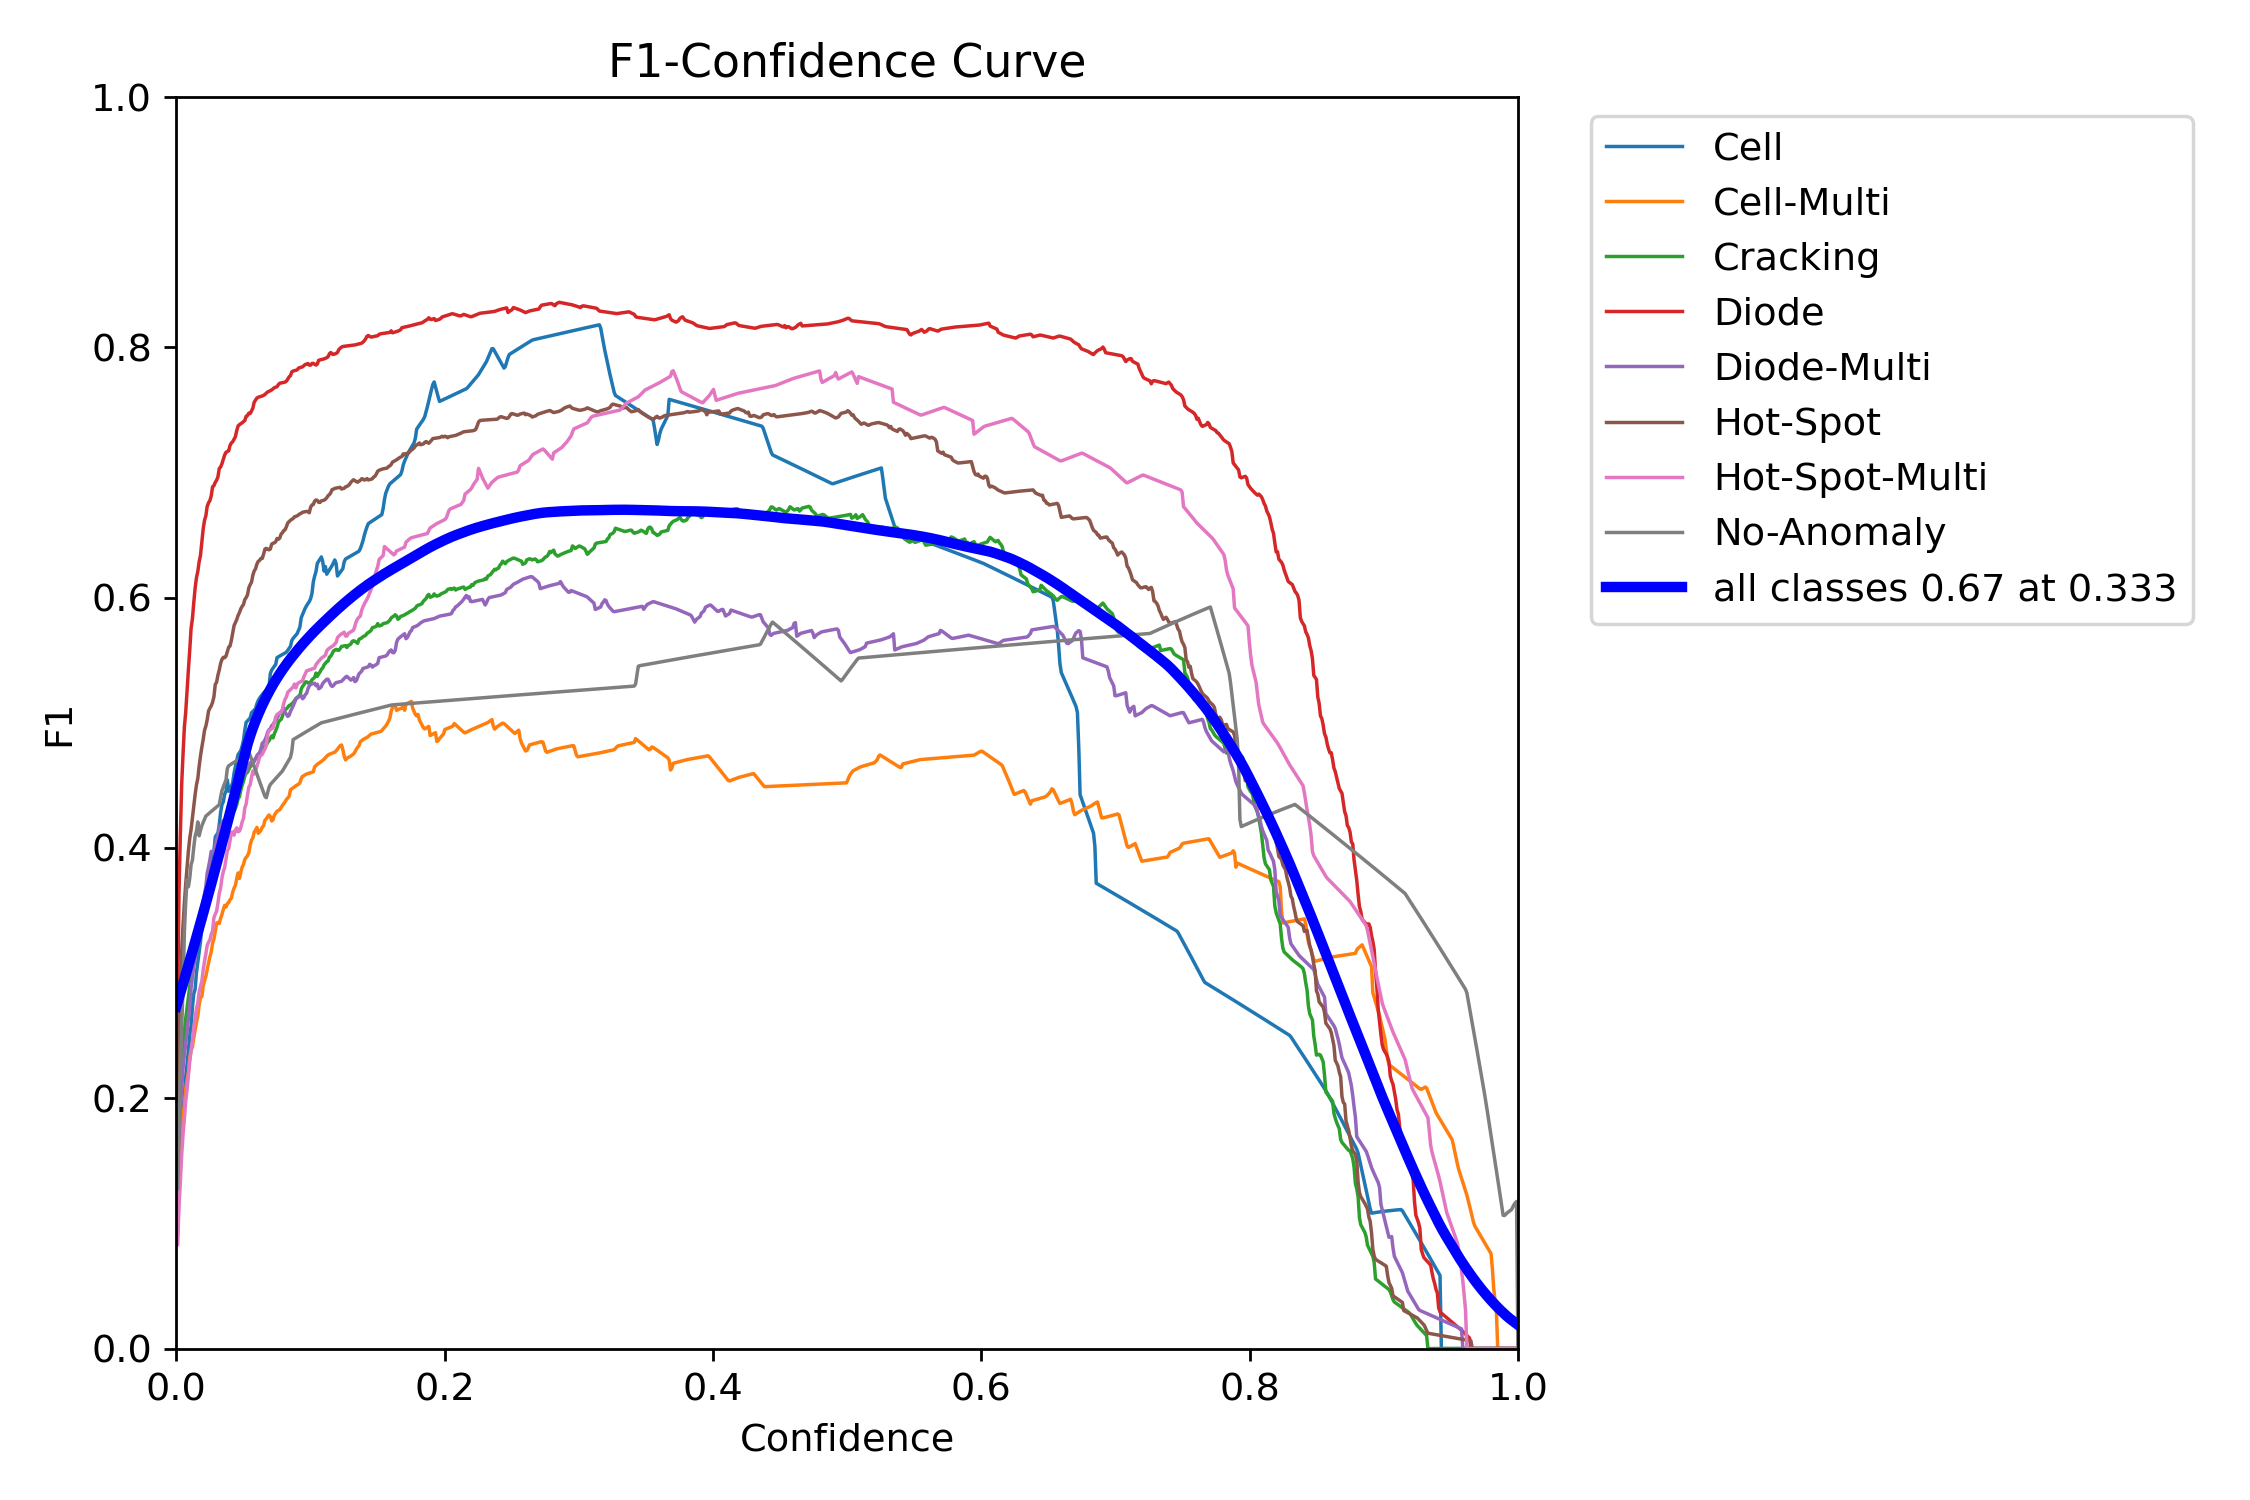
The optimal F1 score is achieved at a confidence threshold of approx 0.333. This informs our deployment strategy to balance missed detections against false alarms.

Class-Specific Reliability

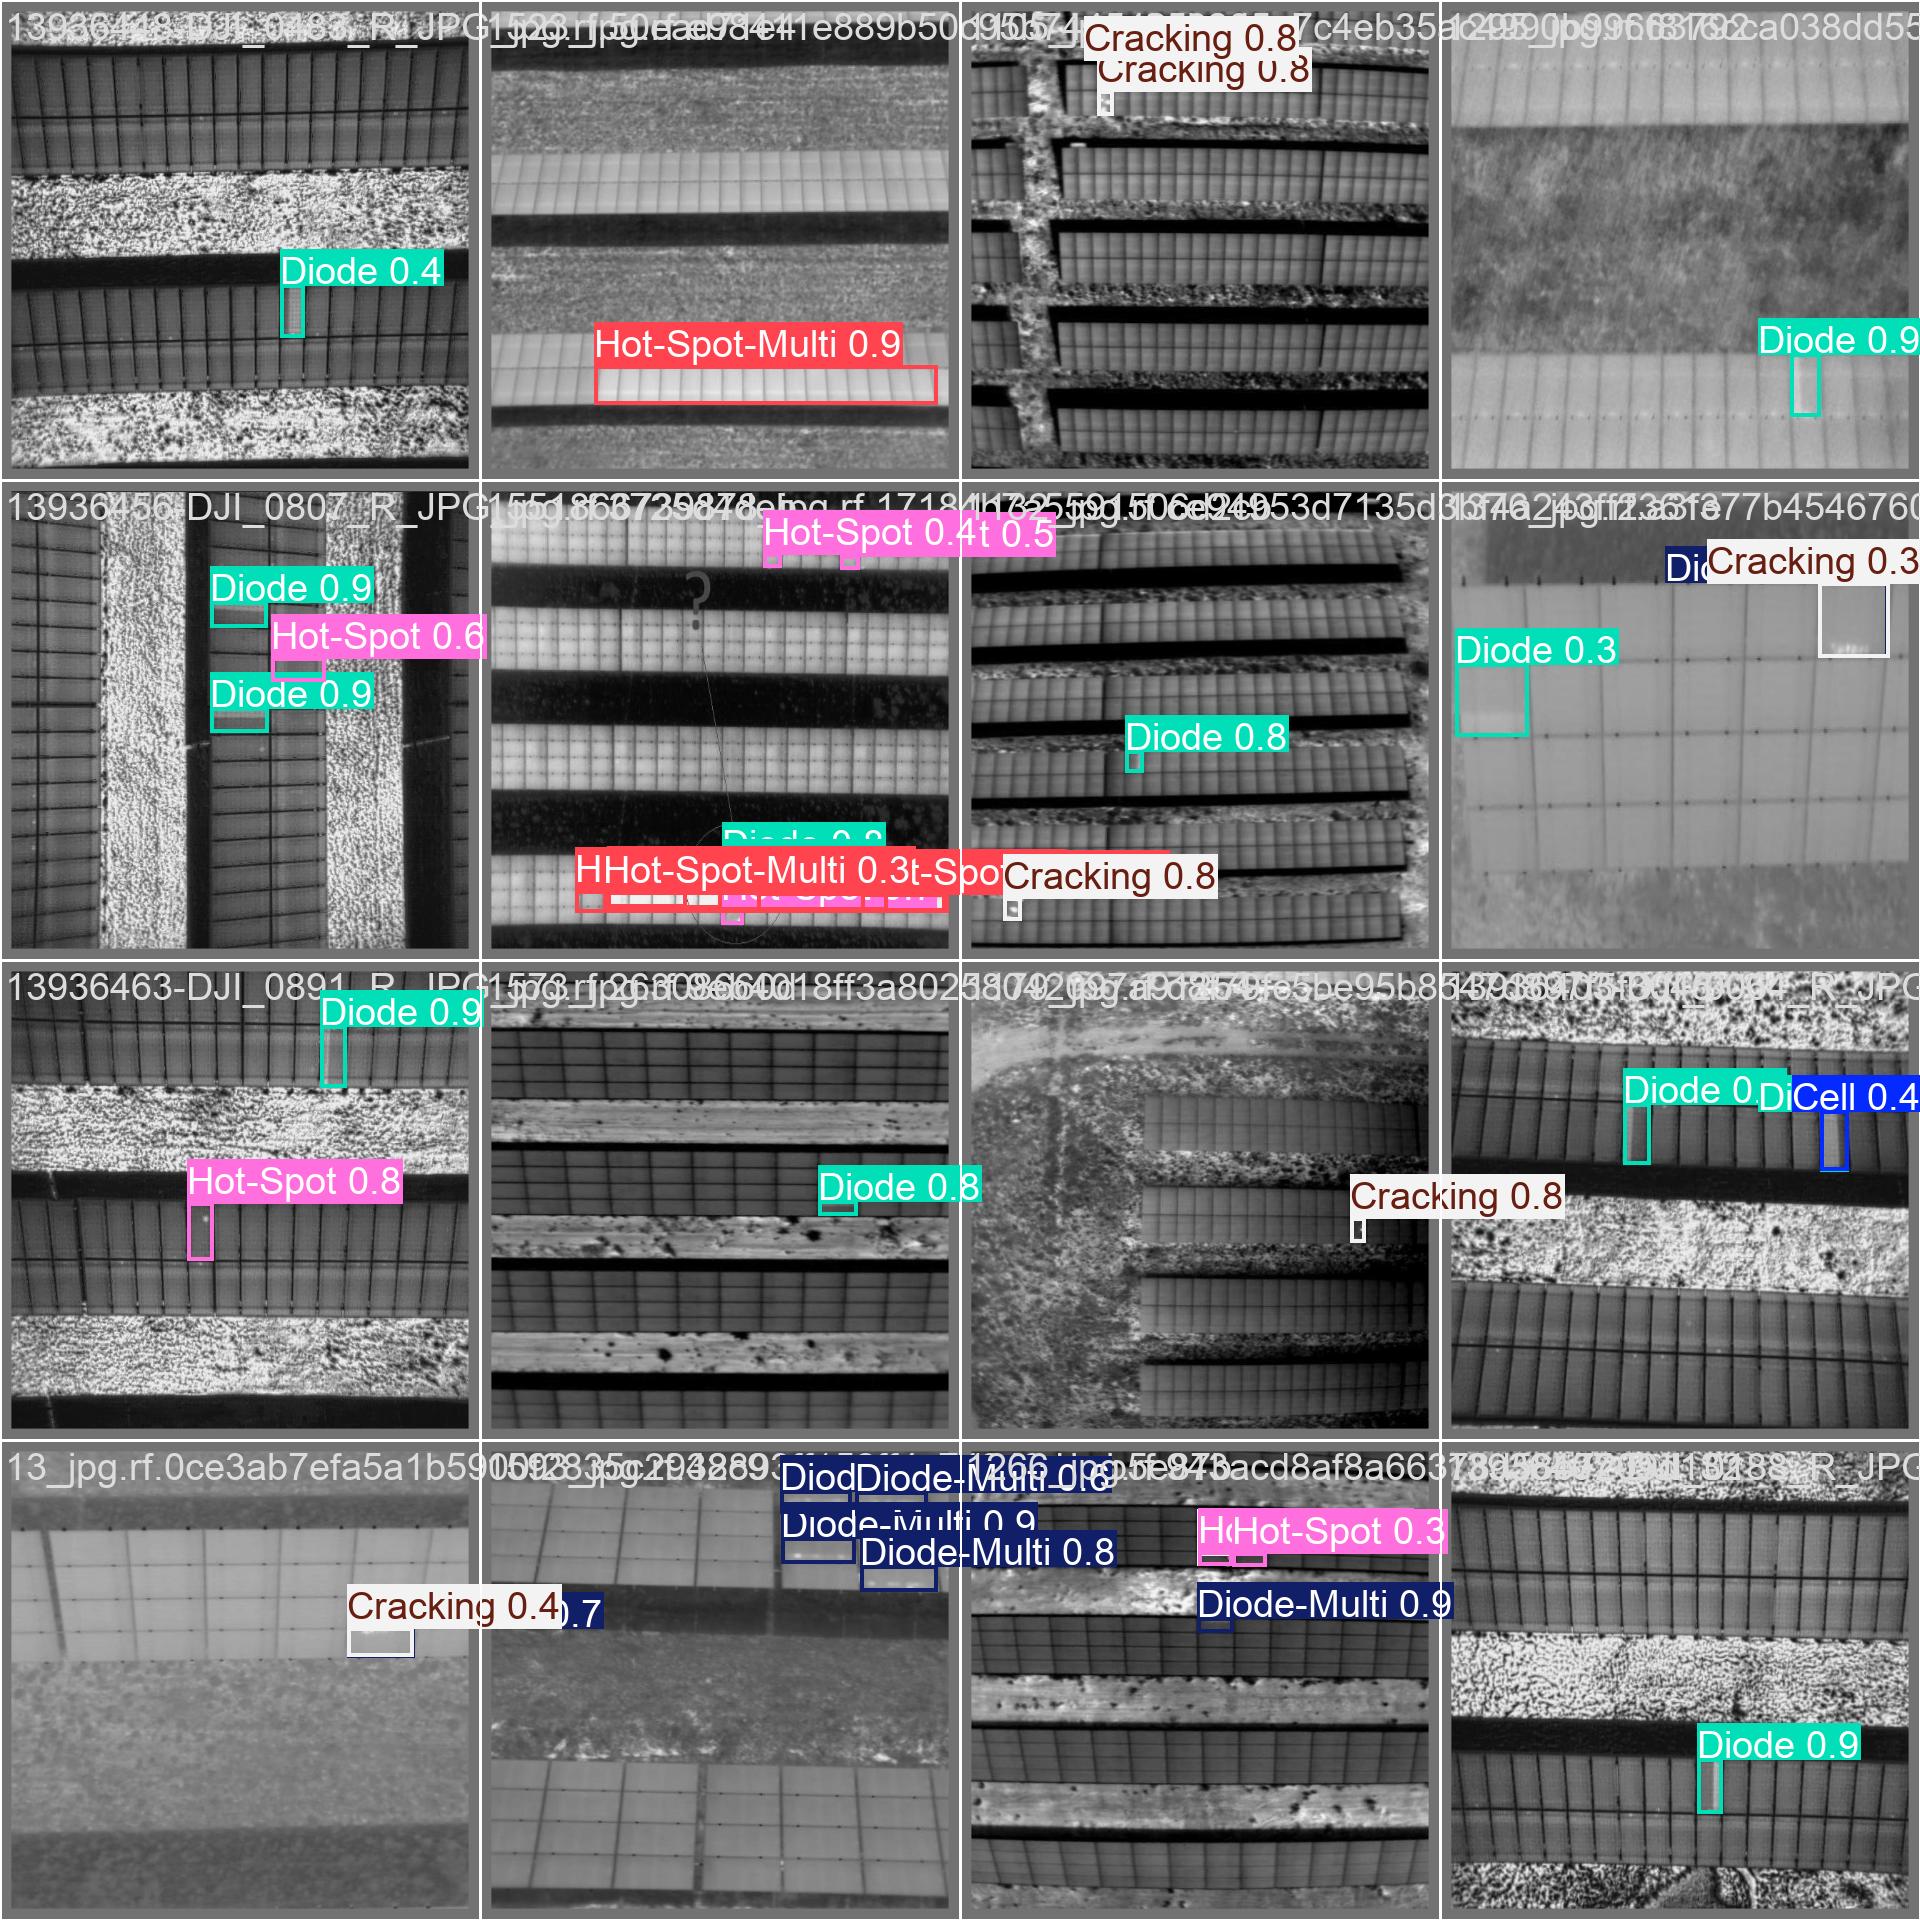
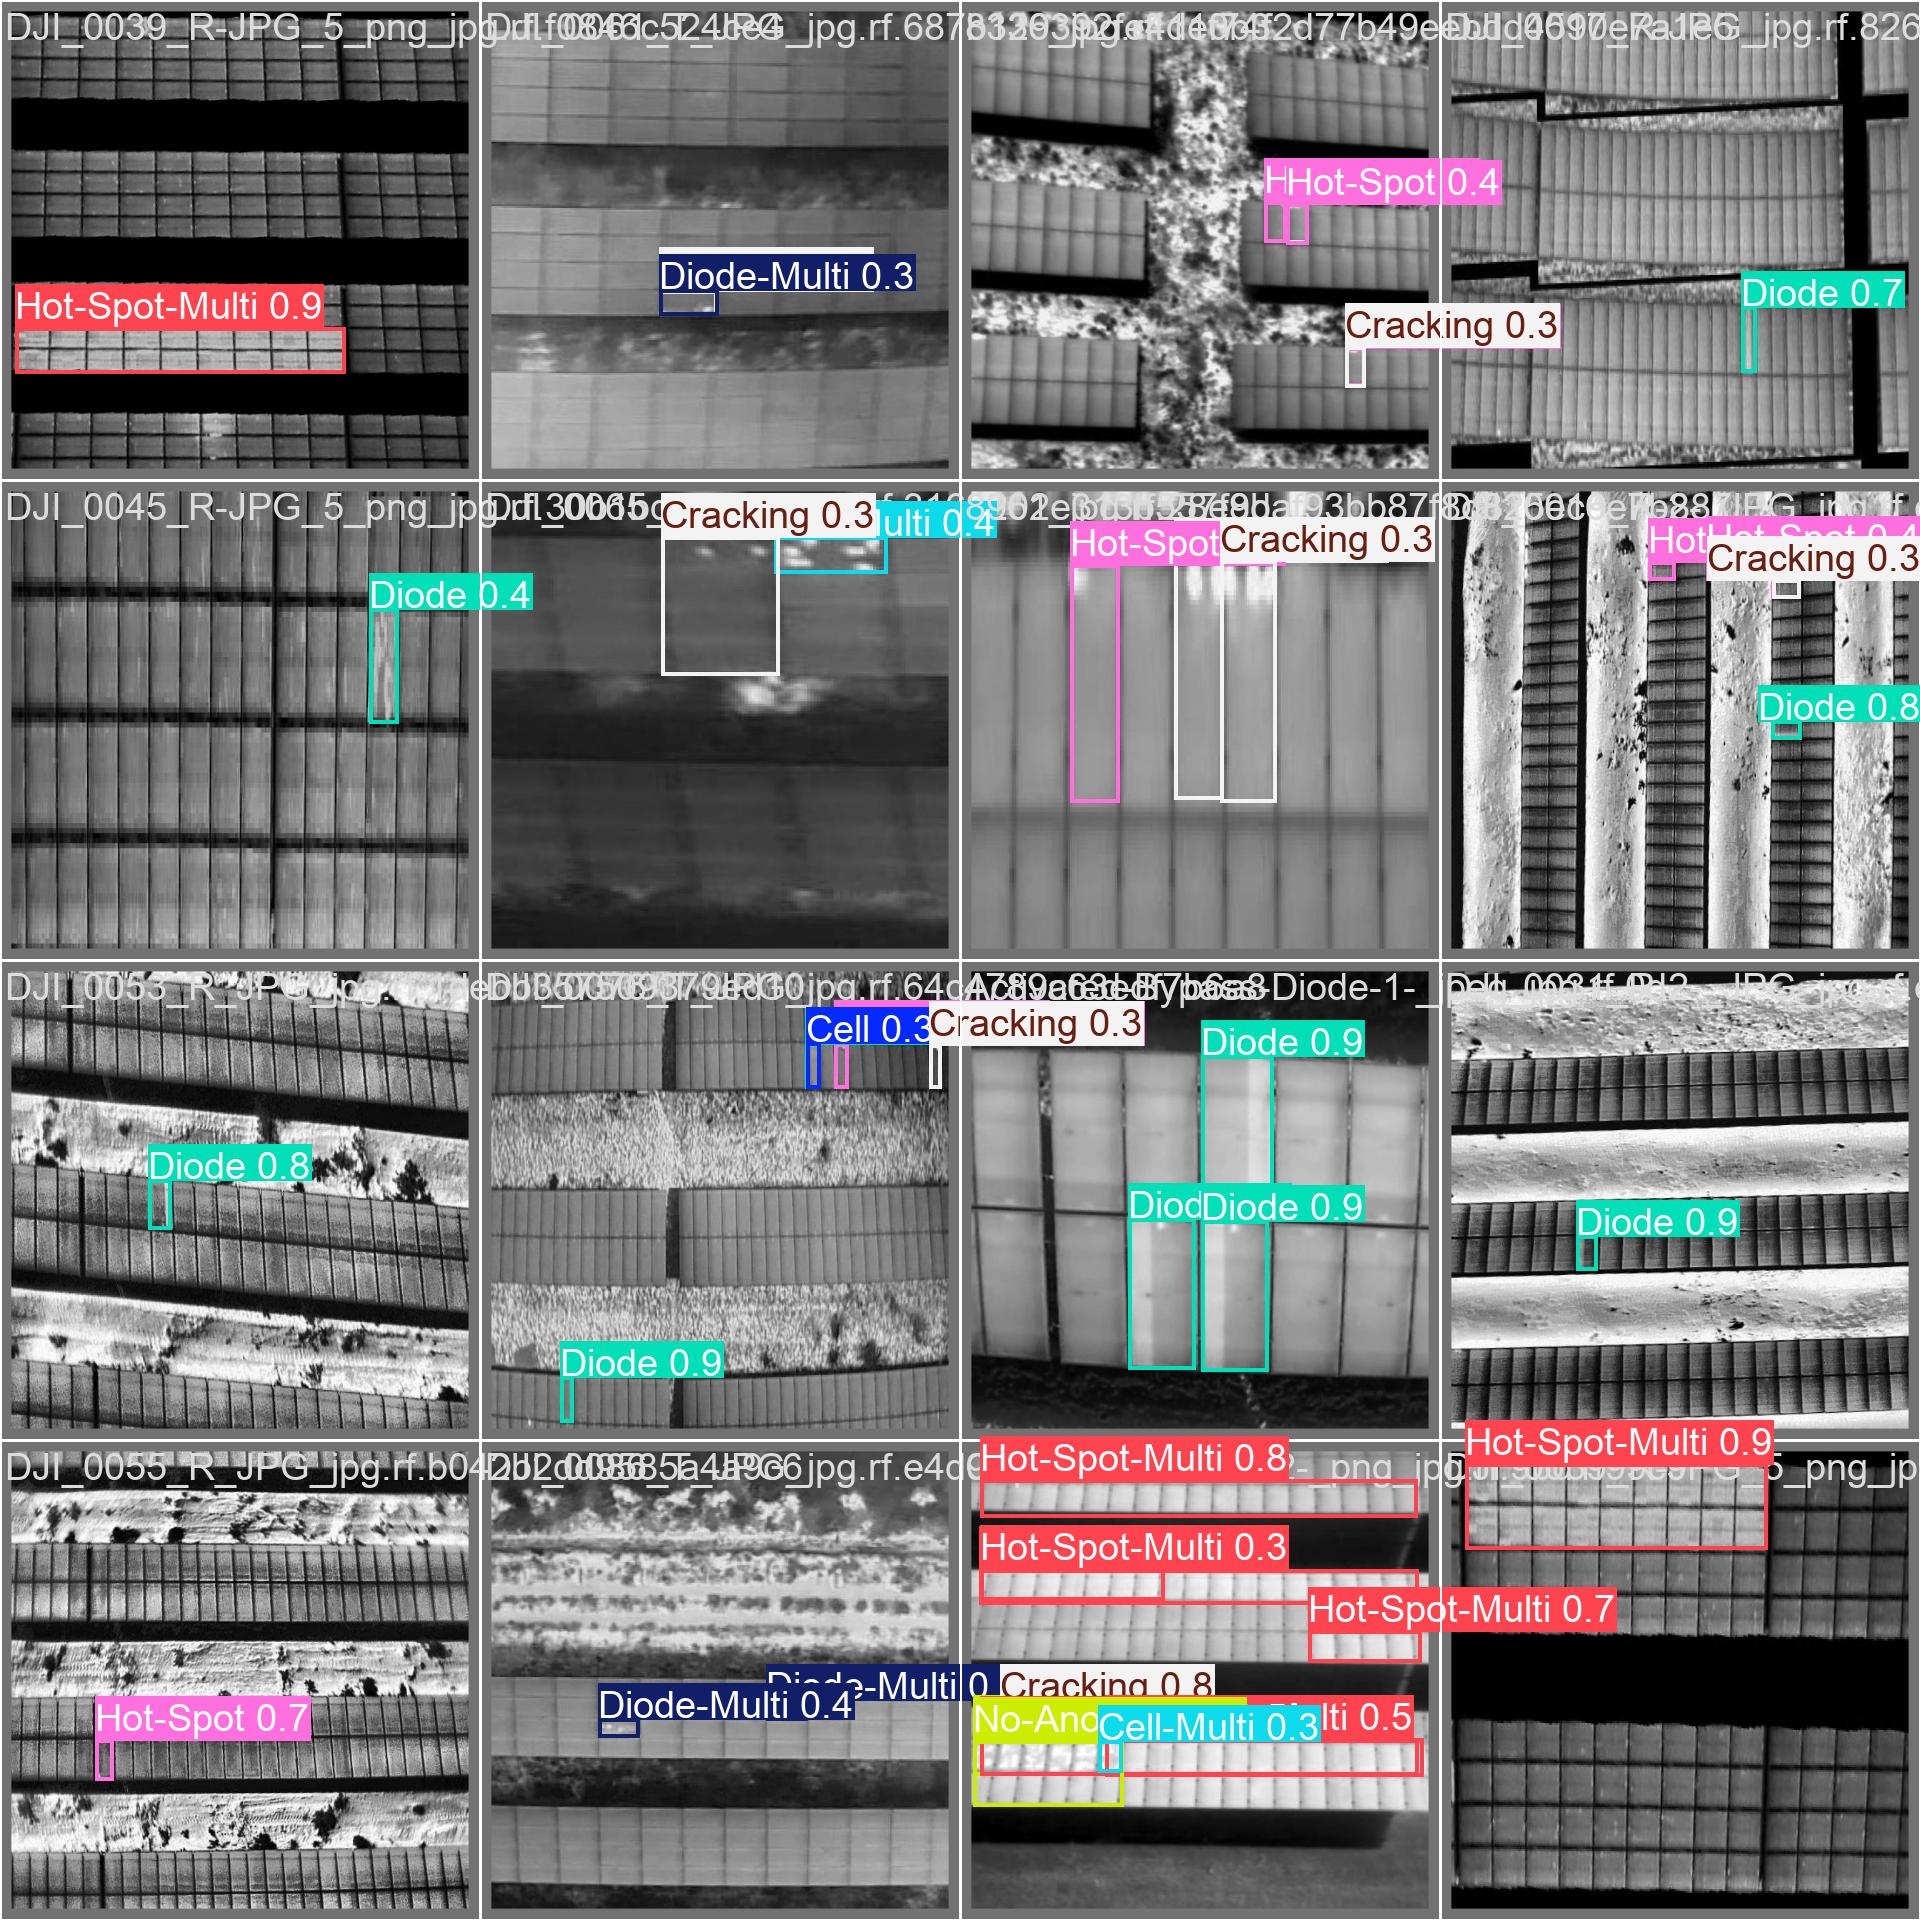
Strong Performance: Diode (0.88), Cell (0.83), Hot-Spot (0.79).
Review Needed: No-Anomaly (0.49) - Model is conservative/paranoid (safer for inspections).

Live Detections: Validation Batches

The following images demonstrate the model's ability to localize multiple concurrent faults on a single panel string. Note the accurate bounding boxes around "Diode" and "Hot-Spot-Multi".

Validation Batch 0 Predictions

Batch 0: Complex Multi-Faults

Validation Batch 1 Predictions

Batch 1: Diode & Cracking

Validation Batch 2 Predictions

Batch 2: High Confidence Hot-Spots

Business Case: Why Automate?

Operational Efficiency

Transitioning to AI-driven inspection reduces analysis time by orders of magnitude. While a human inspector needs minutes to review complex thermal imagery, YOLOv11 processes frames in milliseconds.

  • Fire Safety: 79% detection rate for Hot-Spots allows for preemptive maintenance before failure.
  • Yield Optimization: 88% precision on Diode faults ensures string efficiency is maintained.
  • Scalability: Inspect 50MW or 500MW plants with the same software infrastructure.

Time per Image (Log Scale)

Full Project Notebook

Download PDF

Unable to display PDF directly.

Click here to download the full report.